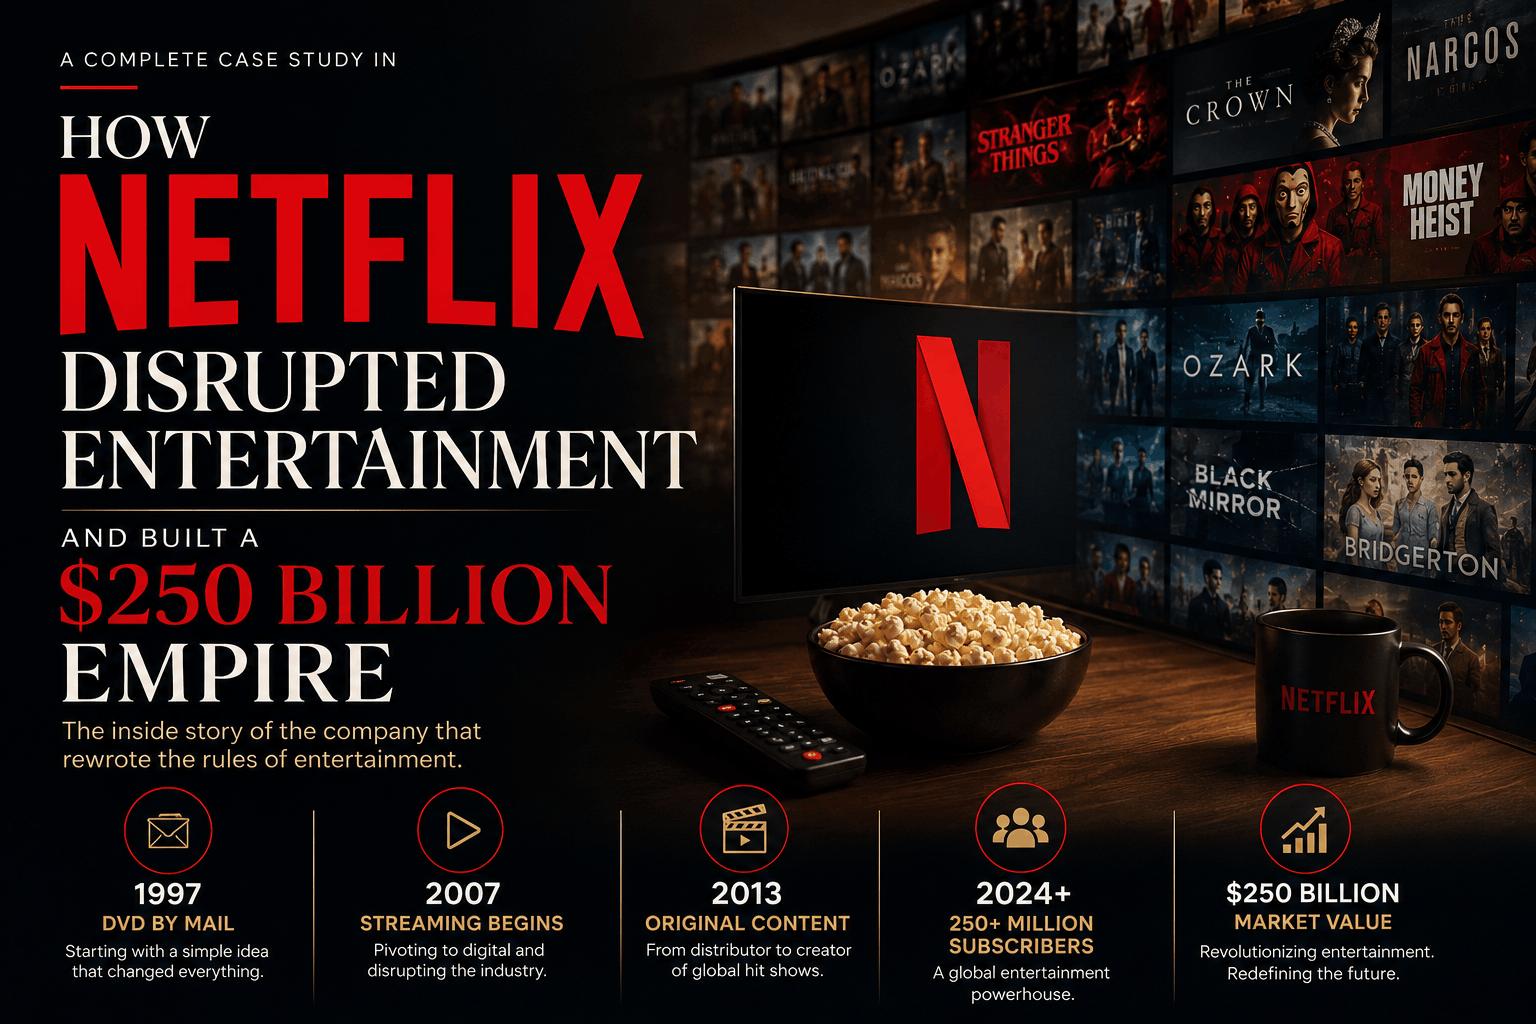
In 1997, when Reed Hastings and Marc Randolph founded Netflix, they had a simple idea: rent DVDs online by mail. No late fees. No brick-and-mortar stores. Just convenience.
Yet today, Netflix operates in 190+ countries, has 250+ million subscribers worldwide, generates $33+ billion in annual revenue, and has fundamentally transformed how the world consumes entertainment. More remarkably, they completely disrupted a $50+ billion video rental industry (Blockbuster) and are now competing with Hollywood studios themselves.
This comprehensive case study reveals how Netflix didn’t just succeed—they revolutionized an entire industry, pioneered the streaming economy, built a data-driven content machine, and created a business model so powerful that every major company from Disney to Amazon has been forced to copy it.
—
Part 1: The Genesis – Understanding Netflix’s Foundation (1997-2006)
1.1 The Original Problem & Solution
In the 1990s, video rental was dominated by Blockbuster—a chain of 9,000+ physical stores with strict late fees and limited selection.
Customer Pain Points That Netflix Solved:
- ❌ Late fees → ✅ No late fees (revolutionary)
- ❌ Limited selection → ✅ 100,000+ titles available
- ❌ Drive to store → ✅ Delivered to mailbox
- ❌ Return within 24 hours → ✅ Keep as long as you want
- ❌ Geographic limitation → ✅ Available everywhere
Netflix’s Innovation: Subscription-based model ($9.99-$15.99/month) with unlimited rentals, free shipping, and zero late fees.
Business Model: This was revolutionary at the time. Blockbuster made 15-20% of profit from late fees. Netflix eliminated this, making customers trust them immediately.
1.2 Why Blockbuster Didn’t See It Coming
Blockbuster’s Fatal Mistakes:
- Late Fees Dependency: Generated 15-20% of Blockbuster’s profit. Netflix’s “no late fees” directly attacked this core revenue stream.
- Physical Store Economics: High rent and labor costs locked them in. Netflix’s mail model had superior unit economics.
- Incumbency Blindness: Blockbuster founder John Antioco reportedly laughed at Netflix. Couldn’t imagine mail rental scaling.
- Stuck with Legacy: Billions invested in stores. Couldn’t abandon without financial collapse.
Netflix’s Advantage: Started with zero stores, zero late-fee revenue to defend. Could optimize entire business model from scratch. This is classic disruption—the incumbent cannot move because their existing business model would be destroyed.
1.3 The Struggle Years (1997-2003)
Despite innovative idea, growth was slow:
- 1997: Founded, very limited reach (San Jose area only)
- 2000: Expanded nationally, but still niche
- 2002: First profitable quarter (takes 5+ years)
- 2003: 1 million subscribers (vs. Blockbuster’s 120+ million)

Why Growth Was Hard:
- People loved Blockbuster (habit, familiarity, immediate gratification)
- Internet required computers (less common in 2000)
- Mailing delays (not instant like stores)
- Limited content initially (building library took time)
- Need to prove model works (chicken-and-egg problem)
Key Achievement: Netflix didn’t try to beat Blockbuster at their own game. They created a new game entirely with different rules.
—
Part 2: The Streaming Pivot – From DVD to Digital (2007-2012)
2.1 The Decision That Changed Everything
In 2007, Netflix launched Netflix Streaming—allowing instant viewing without waiting for DVDs.
This decision was shocking because:
- Cannibalized their own DVD business (giving up profitable line)
- Required massive infrastructure investment
- Content licensing was extremely expensive
- Internet speeds weren’t ready yet
- Competitors (Apple iTunes, Amazon) also entering space
But Netflix saw the future: Streaming was inevitable. Better to disrupt yourself than be disrupted by someone else. This is strategic courage—sacrifice short-term profits for long-term dominance.
2.2 The Content Strategy Revolution
Netflix didn’t just offer movies. They created original content unprecedented for rental/streaming platforms.
Traditional Media Model:
- Movie studios make content
- Theaters show it (exclusive window)
- Pay TV licenses (months later)
- Free TV (years later)
- Home video/rental (final step)
- Multiple year release windows protected each channel
Netflix Model:
- Netflix commissions content directly from creators
- Netflix owns relationships with talent
- Netflix controls distribution
- Netflix becomes the studio + theater + distributor
- Global simultaneous release (no windows)
Original Content Timeline:
| Year | Major Release | Impact |
|---|---|---|
| 2013 | House of Cards | $100M budget proved originals work |
| 2014 | Orange is the New Black | Expanded to female/LGBTQ audience |
| 2015 | Daredevil, Jessica Jones, Narcos | Diversified across genres |
| 2019 | Squid Game (Korean) | Global phenomenon, 1B+ hours watched |
2.3 The Data Science Advantage
Netflix’s Secret Weapon: Data
Netflix used viewer data in ways Hollywood never had before:
- Viewing patterns (what people watched, paused, replayed)
- Completion rates (did they finish?)
- Search behavior (what were they looking for?)
- Geographic preferences (regional patterns)
- When people watched (time patterns)
- Cross-country preferences (international differences)
How Netflix Used This Data:
- Content Development: Knew before making House of Cards that political dramas + Kevin Spacey would work
- Personalization: Recommendation algorithm predicts what user will watch next (drives 80%+ of viewership)
- Production Decisions: Cancelled shows based on completion rates, not critics
Traditional Hollywood: Relied on executive intuition, expensive pilots, years to get feedback.
Netflix Advantage: Real data from 250M+ viewers, instant feedback, scientific approach to content decisions.
—
Part 3: Subscriber Growth and Revenue Evolution (2012-2023)
3.1 Subscriber Growth Acceleration
Timeline:
- 2012: 28 million subscribers (mostly USA)
- 2014: 54 million subscribers (international growing)
- 2016: 93 million subscribers (streaming dominates DVD)
- 2018: 139 million subscribers (worldwide presence)
- 2020: 195 million subscribers (pandemic accelerates growth)
- 2023: 250+ million subscribers (mature/plateauing in some markets)
CAGR (2012-2023): 18%+ annually (exceptional sustained growth)
3.2 What Drove Growth
1. Content Quality: Original series became prestigious. Competition from Hollywood. Must-have platform for entertainment.
2. International Expansion: Netflix in 190+ countries. Localized content (Korean, Spanish, etc.). Global entertainment platform.
3. Technology/UX: Incredible app experience. Seamless across devices. Download for offline viewing. 4K/HDR quality.
4. Pricing Flexibility: Multiple tiers ($6.99-$22.99). Premium ad-supported tier (2022+). Flexible payment options.

3.3 Revenue Model Evolution
| Phase | Period | Model | ARPU |
|---|---|---|---|
| Phase 1: DVD | 1997-2012 | Subscription rental | $15.99/month |
| Phase 2: Transition | 2012-2015 | DVD + Streaming | $11.99/month avg |
| Phase 3: Streaming | 2015-2023 | Pure streaming | $13-15/month |
3.4 Unit Economics
| Metric | Value | Importance |
|---|---|---|
| Total Subscribers | 250+ million | Scale |
| ARPU (Annual) | $132-156 | Revenue efficiency |
| Gross Margin | 35-42% | Profitability |
| Operating Margin | 20-25% | Profitability |
—
Part 4: The Disruption – How Netflix Destroyed Blockbuster
4.1 Blockbuster’s Collapse Timeline
Timeline:
- 2004: Blockbuster peak (9,000+ stores, $6B revenue)
- 2007: Netflix streaming launched
- 2010: Blockbuster files bankruptcy (9,000 → 300 stores)
- 2014: Last Blockbuster closes (except one in Alaska)
4.2 The Disruption Process
Phase 1: DVD-by-Mail (1997-2007)
- Netflix: No stores (cost advantage), no late fees (customer advantage)
- Blockbuster: 9,000 stores (liability), late fees (customer disadvantage)
- Result: Netflix grew slowly but steadily. Blockbuster losing market share.
Phase 2: Streaming Introduction (2007-2015)
- Netflix: First-mover in streaming. Building content library.
- Blockbuster: Tried to copy (Blockbuster Online) but too late.
- Result: Netflix became unstoppable. Streaming clearly the future.
Phase 3: Market Dominance (2015-2023)
- Netflix: 250M subscribers, $33B revenue, 20% margins
- Blockbuster: Bankrupt, all stores closed, company dissolved
- Result: Netflix owns entertainment. Blockbuster completely gone.
4.3 Why Blockbuster Couldn’t Compete
Blockbuster’s Dilemma:
- Late fees were 15-20% of profit (couldn’t eliminate)
- Stores were assets but also liabilities (couldn’t abandon)
- Physical model obsolete but company dependent on it
- By the time they tried streaming, Netflix had 10-year advantage
Classic Disruption Pattern: Netflix didn’t beat Blockbuster at their game. Netflix made the game irrelevant by creating an entirely new business model.
—
Part 5: Competitive Advantages and Strategic Moat
5.1 Data & AI Superiority (The Primary Moat)
Netflix’s Data Advantage:
- 250+ million users generating billions of data points daily
- 10+ years of streaming data (competitors have <5 years)
- Machine learning models trained on massive, unique dataset
- No competitor can access this data (proprietary)
AI Applications:
- Personalization: Recommendation algorithm (80%+ of views come from recommendations)
- Content Development: Identifies trends before trending
- Churn Prediction: Identifies users likely to cancel (enables intervention)
- Pricing Optimization: Different prices for different markets
- Localization: Regional preference identification
Why This Moat Is Unbreakable: Data compounds over time. More users = More data. More data = Better recommendations. Better recommendations = More users. This flywheel is 10 years ahead of competitors and accelerates every year.
5.2 Content Advantage
Netflix Content Investment:
- $15+ billion/year on content (largest spender globally)
- 100+ original series in production
- 50+ original films annually
- Diverse genres and international content
Competitive Advantage:
- Largest content spender (can outbid competitors)
- Direct relationships with top creators
- Only profitable streaming service (can sustain spending)
- Competitors subsidized by parent companies (unsustainable)
5.3 Global Scale & Network Effects
Netflix’s Scale:
- 250+ million subscribers (more than any competitor)
- 190+ countries (global reach)
- Every major content market represented
- Network effects compound (more users = more data = better product)
Competitive Advantage: Scale advantage creates flywheel Disney+, Amazon Prime, others cannot match for 10+ years.
—

Part 6: Financial Performance and Profitability
6.1 Revenue Growth Trajectory
Netflix Revenue Evolution:
- 2010: $2.0 billion
- 2012: $3.9 billion
- 2014: $5.5 billion
- 2016: $8.8 billion
- 2018: $15.8 billion
- 2020: $24.9 billion
- 2023: $33.2 billion
CAGR (2010-2023): 18%+ annually (sustained exceptional growth)
6.2 Profitability Transformation
| Year | Revenue | Operating Income | Op. Margin | Net Income |
|---|---|---|---|---|
| 2015 | $6.8B | $0.5B | 7% | $0.1B |
| 2017 | $11.7B | $1.3B | 11% | $1.0B |
| 2019 | $20.2B | $3.3B | 16% | $1.9B |
| 2021 | $29.7B | $6.2B | 21% | $5.2B |
| 2023 | $33.2B | $7.0B | 21% | $6.0B |
Key Achievement: Netflix is the only major streaming service consistently profitable. Disney+, HBO Max, Amazon Prime subsidized by parent companies.
6.3 Customer Economics
Per Subscriber Metrics:
- Annual revenue per user (ARPU): $132-156
- Customer lifetime value (LTV): $660-780
- Gross margin per customer: 35-40%
- Operating margin per customer: 20%+
- Average tenure: 4-5 years
- Monthly churn rate: 2-3%
Why These Metrics Are Exceptional: Streaming is capital-light business. Each new subscriber adds profit at minimal cost. This creates compounding profitability growth.
—
Part 7: Challenges and How Netflix Overcame Them
7.1 Content Cost Explosion
The Challenge (2020-2023):
- Early years: Content cheap ($50M for series)
- 2020s: Top talent expensive ($300M+ for series)
- Sports content: Extremely expensive (bidding wars)
- Content fragmentation: Must serve every demographic
Netflix Response:
- Efficiency focus: Cancel underperforming shows
- Pricing power: Raise prices (passing costs to subscribers)
- Ad-supported tier: Higher margin business model
- International content: Often cheaper AND better ROI
- Selective cancellations: Make decisions based on data
7.2 Market Saturation
The Challenge (2022-2023):
- USA: Approaching saturation (70%+ internet users have Netflix)
- Growth slowing in mature markets
- International growth strong but lower ARPU
- Company faced slowdown in subscriber growth
Netflix Response:
- Ad-supported tier (2022): Basic with Ads ($6.99/month)
- Higher margin than premium tier
- Attract price-conscious subscribers
- Password sharing crackdown: 30M+ shared accounts
- Geographic expansion: India, Southeast Asia, Africa
7.3 Competitive Intensity
The Challenge:
- Disney+: $13B subscriber business, 150M+ subscribers
- HBO Max: 70M+ subscribers
- Amazon Prime: 200M+ Prime Video users
- Apple TV+: Prestige content strategy
- Quality war: All competing for top creators
Netflix Advantages Despite Competition:
- Only profitable streaming service (sustainable model)
- Most subscribers globally (250M+ vs. competitors 70-150M)
- Data/AI moat (10+ year advantage)
- Can outspend competitors and maintain profits
- Brand ownership: Netflix = Streaming
—
Part 8: Key Strategic Lessons for Business Leaders
8.1 Disrupt Yourself Before Someone Else Does
Lesson: Netflix disrupted their own DVD business with streaming.
Why This Matters: Netflix could have delayed streaming to protect DVD profits. Instead, they embraced cannibalization and became the disruptor instead of disrupted.
Application: Identify your core business threat early. Be willing to sacrifice near-term profits for long-term dominance. Speed to market beats protecting legacy revenue.
8.2 Build Network Effects into Business Model
Lesson: Netflix’s flywheel: More users → More data → Better recommendations → More users.
Why This Matters: Network effects create unfair advantage. Competitors entering market with cold start problem face exponential disadvantage. 10-year advantage becomes 20-year advantage.
Application: Design business model to create network effects. First-mover advantage critical in network effect businesses. Late entrants face compounding disadvantage.

8.3 Data & AI as Competitive Advantage
Lesson: Netflix’s data moat more defensible than content. Competitors can buy content and talent. Cannot replicate 10+ years of user data.
Why This Matters: AI models trained on massive dataset unbeatable. Data advantage compounds over time.
Application: Collect first-party data obsessively. Build AI/ML capabilities early. Use data to guide decisions. Competitive advantage in data > competitive advantage in assets.
8.4 Go Global, Think Local
Lesson: Netflix succeeded globally by thinking locally.
Why This Matters:
- Korean content (Squid Game) breaks globally
- Spanish content (Money Heist) becomes global hit
- Local authenticity creates global appeal
- One-size-fits-all approach would fail
Application: Global platform, local content strategy. Hire local talent/creators. Understand regional preferences. Global reach + local relevance = winning formula.
8.5 Technology & UX as Competitive Advantage
Lesson: Netflix’s app and recommendation engine as important as shows.
Why This Matters:
- Show quality matters (many platforms have good shows)
- Technology/UX makes difference in daily experience
- Recommendation engine drives 80%+ of views
- Seamless experience keeps people engaged
Application: Don’t compete solely on product/content. Build technology/UX as core competitive advantage. Invest in infrastructure even if invisible to users. Better experience = better engagement = better retention.
8.6 Financial Discipline Beats Growth At All Costs
Lesson: Netflix is the only profitable streaming service. Competitors still subsidized by parent companies.
Why This Matters:
- Profitability enables reinvestment
- Profitability creates moat (sustainable model)
- Growth at all costs eventually fails (no profits)
- Netflix’s 21% margins show balance works
Application: Balance growth and profitability. Don’t sacrifice unit economics for subscriber growth. Build sustainable business, not just hockey stick graphs.
—
Conclusion: The Netflix Blueprint for Building $250 Billion Empires
Netflix’s journey from DVD rental startup to $250B entertainment powerhouse wasn’t accidental. It resulted from:
- Identifying True Customer Pain: Late fees, inconvenience, limited selection
- Simple Solution: Subscription model, no late fees, unlimited access
- Willingness to Disrupt Yourself: Pivot to streaming despite cannibalizing DVD
- Massive Content Investment: Becoming a studio, not just distributor
- Data Science Excellence: Recommendation engine, AI/ML, data moat
- Global Thinking + Local Execution: Worldwide platform with regional content
- Technology & UX Focus: Best-in-class product, not just content
- Network Effects: Scale creating competitive moat
- Financial Discipline: Only profitable streaming service
- Long-Term Vision: 25+ year horizon, not quarterly focus
For entrepreneurs and business leaders, Netflix offers a masterclass in:
- How to disrupt incumbent industries
- How to build network effects into business model
- How to use data/AI as strategic advantage
- How to expand globally with local sensitivity
- How to build defensible competitive moats
- How to balance growth and profitability
- How to invest in technology (not just product)
- How long-term thinking creates competitive advantage
The Netflix story isn’t just about entertainment it’s about how vision, strategy, and relentless execution can completely transform an entire industry and create a $250+ billion global empire.
—
Financial Snapshot (2023)
| Annual Revenue | $33.2 billion |
| Operating Income | $7.0 billion |
| Operating Margin | 21% |
| Net Income | $6.0 billion |
| Subscribers | 250+ million |
| Market Cap | $160+ billion |
| Countries | 190+ |
| Daily Viewers | 150+ million |
About Netflix
- Founded: 1997
- Headquarters: Los Gatos, California, USA
- Founders: Reed Hastings, Marc Randolph
- Current CEO: Ted Sarandos
- Markets: 190+ countries across all continents
- Primary Business: Streaming video subscription (SVOD)
- Content: Original series, films, documentaries, stand-up comedy
- Service Model: Subscription-based (free trial, multiple tiers)
Read Our Next Case Study- How Titan Transformed the Watch Industry: A Case Study in Brand Disruption